Using tikz as an IGSE
An IGSE (Interactive Geometry Software Environment) is a computer program that helps you create dynamic diagrams in different Geometries (planar or 3D Euclidean, or even spherical or hyperbolic!). Click here and there to drop points, select two and construct the segment through them, or the circle centered in the first that goes through the second, etc. Once done with your construction, you can click and hold on any of its elements (let it be a point, a segment, a circle, etc), and while dragging it all over the screen, change the shape of the construction. It is a very valuable tool that allows you to gain a huge insight and intuition on geometric structures, and has helped many a mathematician to pose and solve interesting problems.
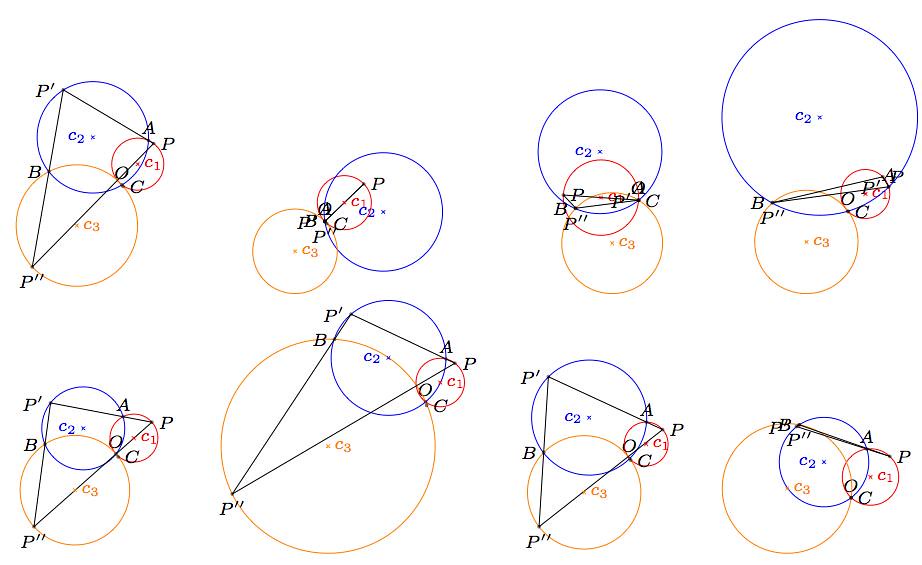
The usual way to include such diagrams in \( \LaTeX \) is by asking the software to produce a proper image, or by grabbing screenshots. But with tikz and a few of its libraries, one can mass produce these diagrams within our code, without the need of a IGSE. The figure above was generated as a tabular with four centered columns, and on each cell of the table a function holding a tikzpicture environment was included.
1
2
3
4
5
6
7
8
\begin{center}
  \begin{tabular}{cccc}
    \construction{1}{1}{-1}{1}{-1}{-1} & \construction{1}{1}{2}{0}{-1}{-1} &
    \construction{-2}{0}{-1}{1}{-1}{-1} & \construction{1}{1}{-1}{3}{-1}{-1} \\
    \construction{1}{1}{-1}{1}{-1}{-1} & \construction{1}{1}{-1}{1}{-3}{-1} &
    \construction{1}{1}{-1}{1}{-1}{-1} & \construction{1}{1}{-1}{1}{-2}{0}
 \end{tabular}
\end{center}
Each tikzpicture environment is written as a function, and produces a variation of the figure in the post Thee Circles. It depends on six variables (the coordinates of the point \( P \), and the coordinates of the centers of the circles \( c_2 \) and \( c_3. \) It looks like this:
1
2
3
4
5
6
7
8
9
10
11
12
13
14
15
16
17
18
19
20
21
22
23
24
25
26
27
28
29
30
31
32
33
\def\construction#1#2#3#4#5#6{
 \begin{tikzpicture}[scale=0.5]
    \coordinate [label=above:$O$] (O) at (0,0);
    \coordinate [label=right:$P$] (P) at ($ ({#1},{#2}) + .2*(rand,rand) $);
    \coordinate [label=right:\textcolor{red}{$c_1$}] (c1)
        at ($ (P)!0.5!(O) $);
    \coordinate [label=left:\textcolor{blue}{$c_2$}] (c2)
        at ($ ({#3},{#4}) + .4*(rand,rand) $);
    \coordinate [label=right:\textcolor{orange}{$c_3$}] (c3)
        at ($ ({#5},{#6}) + .3*(rand,rand) $);
    \node [draw,red] (circle1) at (c1) [circle through=(O)] {};
    \node [draw,blue] (circle2) at (c2) [circle through=(O)] {};
    \node [draw,orange] (circle3) at (c3) [circle through=(O)] {};
    \coordinate [label=above:$A$] (A)
        at (intersection 1 of circle1 and circle2);
    \coordinate [label=left:$B$] (B)
        at (intersection 1 of circle2 and circle3);
    \coordinate [label=right:$C$] (C)
        at (intersection 1 of circle3 and circle1);
    \coordinate (PA) at ($ (P)!4!(A) $);
    \coordinate [label=left:$P'$] (P')
        at (intersection of P--PA and circle2);
    \coordinate (P'B) at ($ (P')!4!(B) $);
    \coordinate [label=below:$P''$] (P'')
        at (intersection of P'--P'B and circle3);
    \draw (P) -- (P') -- (P'') -- cycle;
    \foreach \point in {A,B,C,O,P,P',P''}
    \fill [black,opacity=0.5] (\point) circle (1.5pt);
    \foreach \point/\clr in {c1/red,c2/blue,c3/orange}
    \foreach \angle in {45,135,225,315}
    \draw [\clr] (\point) -- +(\angle:2pt);
  \end{tikzpicture}
}
We need to include the tikz libraries calc and through to be able to handle some of the construction steps, and the randomization bit.